Recently product manager Little Liu has been troubled,
because people keep asking him,
is the cash flow on the PPT written wrong?
Written as cash cow?
The background of the story is roughly,
since clients manage their members on our cloud platform,
we want to display some data for them for free,
to give them some help with their business decisions.
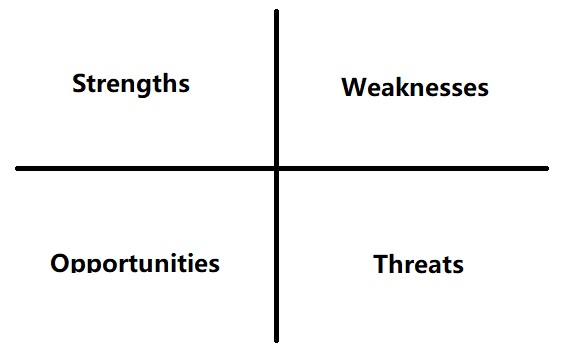
SWOT
Speaking of business-decision analysis methods,
there’s a very famous SWOT analysis method
that analyzes the current situation from four dimensions:
- S, Strengths,
- W, Weaknesses;
- O, Opportunities,
- T, Threats.
For example the Longzhong Plan that Zhuge Liang made during the Three Visits to the Thatched Cottage
is a classic SWOT analysis:
for example, don’t sweat the details
- Strengths:
The general is a descendant of the imperial house, with credibility known throughout the four seas. - Weaknesses:
Now Cao has a million-strong army and holds the emperor to command the lords, this truly cannot be fought against. - Opportunities:
Liu Zhang is weak, Zhang Lu is in the north, the people are prosperous and the country rich but they don't know how to comfort them, men of wisdom long for an enlightened lord. - Threats:
When the general leads the army of Yizhou out of the Qinchuan, who among the common people would not greet the general with food in baskets and drink in jars?
Drawing SWOT as the Trigonometric Reduction Formula Sign-by-Quadrant picture roughly looks like this:
Many chicken-soup little stories describe a scene like this:
Company A used to develop very fast,
but recently hit a bottleneck,
the boss was very troubled.So they spent a million USD hiring people from professional business consulting company B to analyze,
these B company people spent a month on field research,
then spent two days drawing a PPT,
on which were just two charts.
One was a family photo,
because Americans are very family-oriented.
The other was the SWOT analysis.Company A’s boss was furious:
“I didn’t spend a million for you to come make PPT!”
The B company person calmly replied:
“Yes, ten yuan can also get someone to make PPT for you,
but only a million can buy our SWOT analysis.”Upon hearing this brilliant reply,
the meeting room burst into long-lasting enthusiastic applause.
In the end Company A strictly followed the SWOT analysis recommendations,
and sure enough the medicine cured the disease,
the company went back on the path of rapid growth.
:)
There might be a bit too much BS in the story,
but we can roughly understand:
this kind of business analysis is more about using a certain pose
to look at problems from multiple angles,
ultimately providing a general-purpose methodology.
If someone really has the action-power to strictly follow it like in the story,
then there will surely be positive results.
BCG-matrix
Similarly,
the term cash cow actually comes from another set of analysis methods.
Product manager Little Liu assumed everyone had as rich life experience as he did,
and right off the bat threw out this chart:
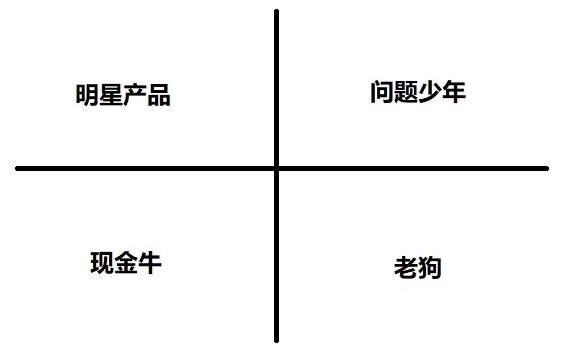
Of course the actual chart he showed was more professional,
this chart is randomly translated and randomly drawn by the author
Everyone was a bit confused,
then quickly pointed out there was a typo in the chart.
Little Liu had no choice,
he could only tell everyone some foreign-language words,
and gave an example:
First, suppose you’re the boss of a multinational corporation.
You have two hundred thousand employees, two hundred factories, more than fifty product lines.
The 10th of every month is payday,
as a capitalist who doesn’t withhold wages,
follows labor law,
and has a conscience,
you find that on the 9th of every month there’s still lots of cash in the account,
but on the 10th there’s basically nothing left.
And your profit margin is much lower than the black-hearted enterprise next door.
So you look at the fifty-plus product lines mentioned above, and start thinking:
Which products make money? Which products can be retired? Which products have room for growth?
Because you read an MBA at SJTU,
you’ve heard the SWOT story,
you feel that’s aimed at company strategy
or a single product.
You don’t want to spend fifty million doing SWOT analysis,
so you brought in San Diego Boston Consulting Group people.
These people, following the ancestral wisdom of Trigonometric Reduction Formula Sign-by-Quadrant,
draw the chart while saying:
To analyze the business, we should plot…
You interrupted their casting:
Chinese please, excuse my bad English
So they introduced it in Chinese:
Boss, a big part of your company’s problem is that the cash flow is unclear.
Like this, let’s draw a chart,
the horizontal axis, from left to right, is ** earn more money > earn less money **
the vertical axis, from bottom to top, is ** spend less money > spend more money **
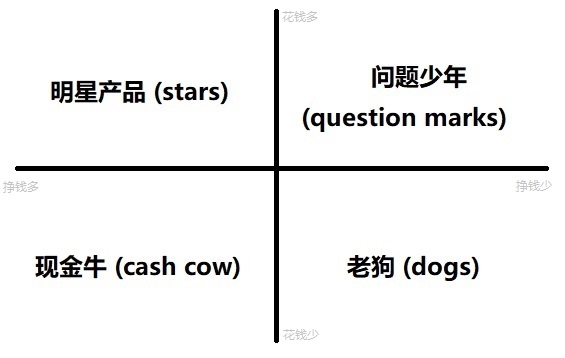
So from the cash perspective,
based on these two dimensions,
let’s look at your company’s products in the four areas.
Upper-left Stars.
This kind of product earns lots of money, spends lots too!
For example the one you advertise on TV every day,
though it sells well, the advertising fees are sky-high.
This is how people first know your company,
must maintain it.Lower-left Cash Cows.
That’s right, these are the products that spend little, earn lots.
They bring substantial income to your company!
Just like cows, they eat grass and squeeze out milk!
Very good! Take good care of them!Lower-right Dogs.
Don’t look at how they now earn little, spend little, with no sense of presence,
they’re usually converted from your company’s cash cows,
for example your old digital camera brand,
which used to be very profitable, but recently got crushed by smartphones.
These products, if you have sentiment, just maintain them.Upper-right Question Marks.
These earn little and spend a lot,
we really can’t predict.
For example a certain giant
had a swollen head from ten consecutive years of losses before.
These products are very likely to become your stars,
even cash cows.
The boss felt this was very scientific.
Later Boston Consulting Group went back and summarized,
this approach gradually became a general-purpose analysis method,
people call it BCG-matrix (Boston Consulting Group Matrix)
Note
Because this article leans toward joke-telling,
many places are mixed with my own mod-tweaks.
The orthodox horizontal axis is Relative market share,
vertical axis is Market growth rate,
the translations of Question Marks and Dogs were also random by me…
For more accurate content please consult the wiki yourself.